Your data, your way
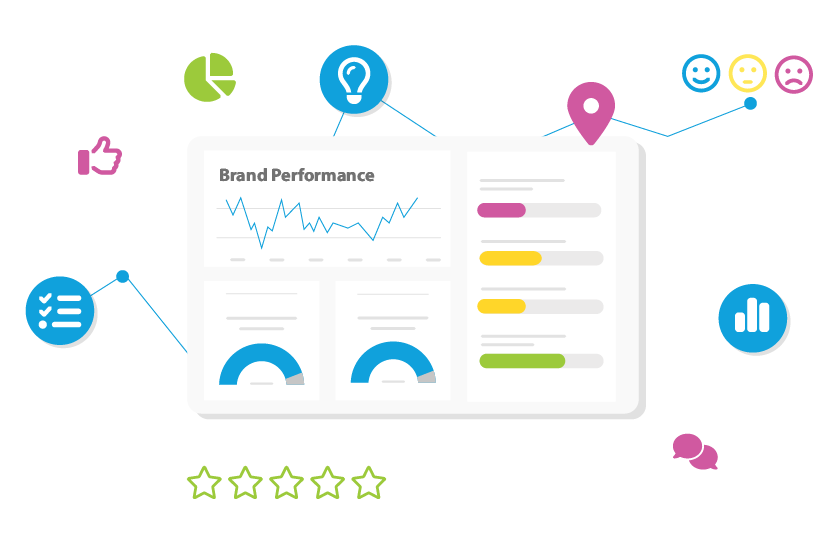
Personalize the data you see with granular filters, permissions and location-based settings.
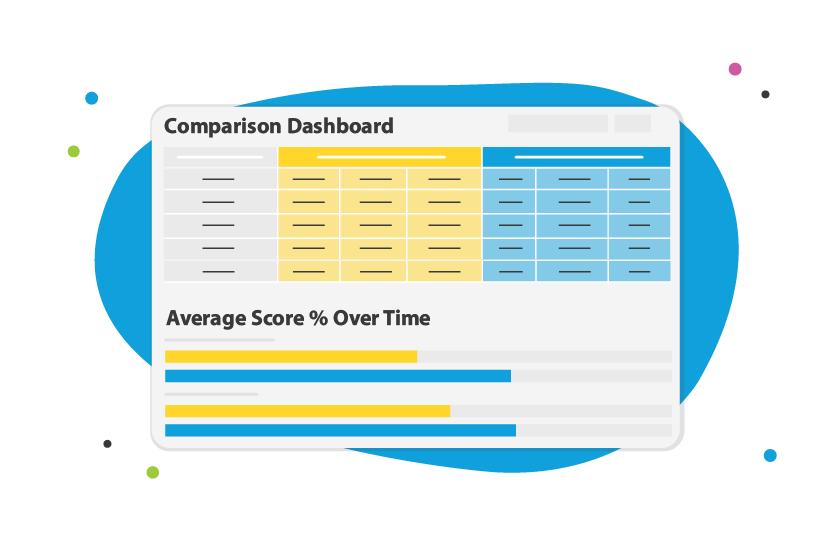
Complete with pre-built location dashboards, charts and granular location attributes, easily compare individual location performance against other locations or overall corporate results.
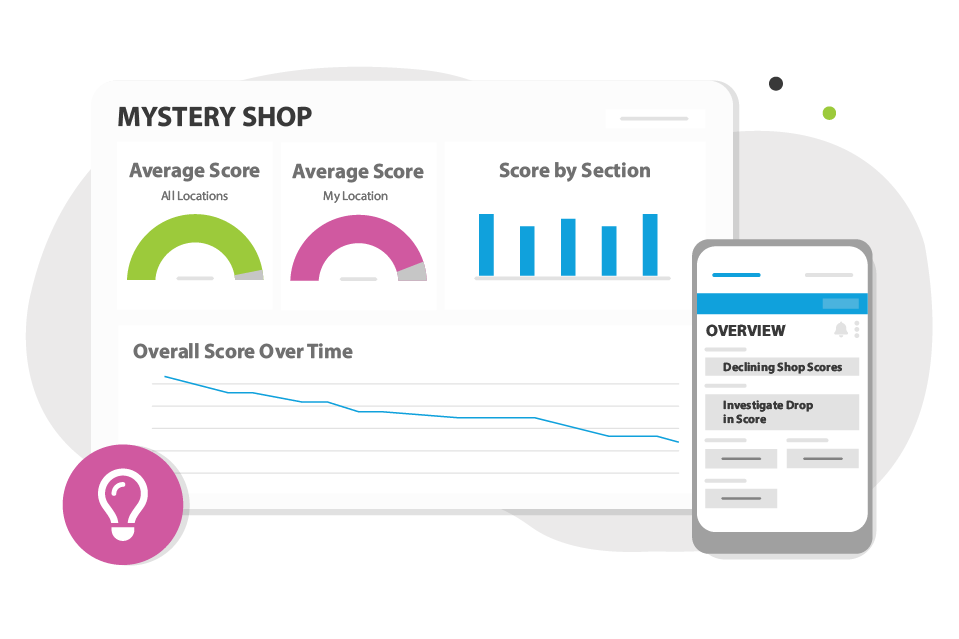
IntouchIntelligence makes it easy to conduct cross-program analysis by seamlessly connecting multiple data sources into one CX analytics tool. Use our built-in survey, audit or mystery shopping tools or connect external data sources.