












Drive-Thru Study 2026
The Industry Benchmark for QSR Drive-Thru Performance
The 26th Annual Drive-Thru Study finds the average drive-thru visit at its fastest since 2018. With data from 2,145 mystery shops at 13 leading QSR brands across three segments, this year's report shows where the lane got faster, what still breaks the experience, and why the human side of the visit matters more than ever.
AS FEATURED IN
What's New in This Year's Study?
The 2026 study keeps the Classic, Chicken, and Beverage segments introduced last year, so you can see how competitors move within their own lanes year over year. This year we also looked at how friendliness shapes the rest of the visit and asked customers what matters most to them. And after introducing Voice-AI Ordering in 2025, this is the first year we can show how the technology is changing.
Segment Benchmarks
Classic, Chicken, and Beverage,
year two.
Burgers and tacos, chicken chains, and drink-first drive-thrus run on different menus and different expectations. See how each segment moved on speed, accuracy, and satisfaction since 2025, and which brands set the pace within their category.
The Power of Friendliness
The human side of the drive-thru.
A friendly interaction does more than make a good first impression. See how friendliness travels with satisfaction, order accuracy, value perception, and whether guests would recommend the brand to others.
The Customer's Voice
What guests say matters most.
For the first time, shoppers also told us what drives their drive-thru choices, from the factor they value most to the flavors they want next. We also added value for money, packaging, and loyalty to the scorecard.
Voice-AI Ordering
The future of the drive-thru, retested.
Last year, locations running voice AI trailed on order accuracy. This year, they led. With a second year on the same 120-visit design, we measured how far voice AI has come and where it still needs work.
Measuring the Forces Shaping Every Drive-Thru Visit.
Unlike traditional consumer surveys, this study gathers data through real-time, unannounced visits by mystery shoppers. These visits offer an authentic snapshot of the customer experience across 13 QSR brands and help establish an industry benchmark.
-
Speed of Service
Speed is the heartbeat of the drive-thru and still the first thing guests judge. This year we looked beyond the average to see how long visits really run and how customers perceive the wait.
- Total, wait, service, and window time
- Time per car in line and impact of stations
- Distribution of visit times and perceived vs. actual speed
- Lane flow ratings
- Year-over-year trends and brand comparisons
-
Order Accuracy
Accuracy is the cornerstone of customer trust, and mistakes carry more weight than just a missing item. We looked at how often orders go wrong, why they go wrong, and what helps get them right.
- Long-term accuracy trends
- Inaccuracy by daypart
- Leading reasons orders were marked inaccurate
- Menu boards and order confirmation
- Brand-to-brand comparisons
-
Suggestive Selling
It's one of the most underused profit levers in the drive-thru. We measured how often crews make the ask, what they offer, and what customers want to try next.
- Frequency of suggestive selling by segment and brand
- What was suggested
- Flavor profiles customers want to try next
- Year-over-year trends
-
Food Quality
The drive-thru is only as good as the food that leaves it. Every brand was scored like for like on the main entree and beverage it was shopped on.
- Taste and temperature of main entrees
- Taste and temperature of beverages
- Beverage mix and flavor
- Side item trends
- Packaging and portability
-
Overall Satisfaction
The drive-thru is more than the sum of its parts. We looked at how the whole visit comes together and which moments travel with a satisfied guest.
- Satisfaction and friendliness by brand
- The influence of friendliness on other metrics
- Lane flow and satisfaction
- Value for money
- Year-over-year trends
-
Voice-AI Ordering
Automation is no longer the newest player in the drive-thru. Now it has a track record. We compared AI-enabled locations against employee-led ordering at the same brands, and against last year's results.
- Voice-AI vs. employee-led performance
- Year-over-year comparison
- Tone and ease of AI interactions
- Order confirmation and comprehension
- Automation vs. true AI ordering
Research Methodology: How we collected the data
With the help of our extensive mystery shopper network, we performed 2,145 mystery shop orders across the U.S.
Mystery Shop Allocation
We conducted 165 mystery shops per brand across 13 U.S. brands, with locations selected for broad geographic coverage. Beyond standard drive-thru evaluations, shoppers also completed 40 visits at 3 brands testing Voice-AI Ordering, totaling 120 AI-enabled orders where an AI assistant replaced the crew member.
Timing
The shopping period spanned from June to July 2026, with orders placed at various times of day (breakfast, lunch, afternoon, and dinner) and days of the week to capture a balanced view of performance in real-world conditions. Beverage brands were shopped exclusively during the breakfast daypart.
Metrics Measured
The study evaluated five key factors that influence consumer choice: Speed of Service, Order Accuracy, Suggestive Selling, Food Quality, and Overall Satisfaction.
The key takeaways.
The Emerging Experiences study provides valuable data to guide your investment decisions and improve your customers' ordering and pickup experiences.
Tech innovation boosts customer satisfaction
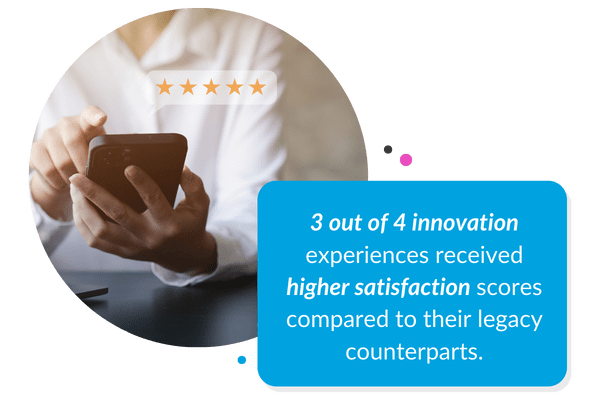
3 out of 4 innovation experiences received higher satisfaction scores compared to their legacy counterparts.
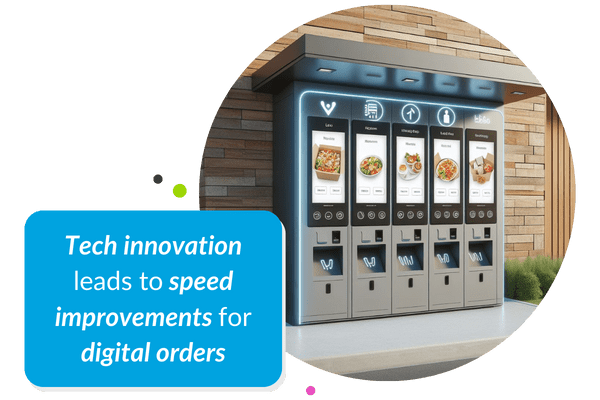
Tech innovation leads to speed improvements for digital orders
Investing in technology has streamlined digital order processing for pickup. Whether customers were picking up their orders in a drive-thru, pickup window, or food locker, the study reveals that these innovations have reduced the time spent picking up.
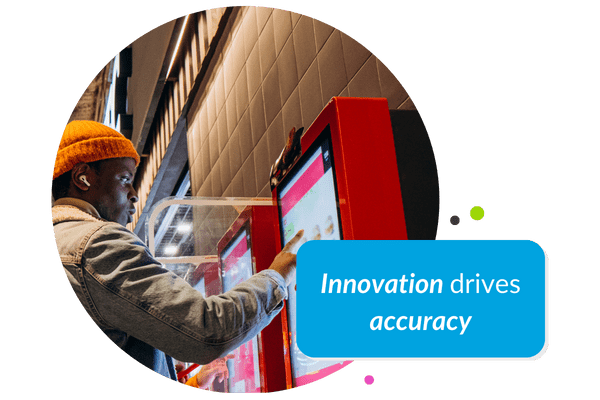
Innovation drives accuracy
The data suggests that the overall order accuracy scores of 3 out of 4 innovation experiences outperformed those of the legacy experiences.
Frequently Asked Questions
-
What is the Intouch Insight Drive-Thru Study?
It's the annual benchmarking study of drive-thru performance, now in its 26th year. It uses real-time mystery shop visits across major Quick Service Restaurant brands to measure how the drive-thru is evolving, including ongoing research into Voice-AI Ordering.
-
Which brands were included in the Drive-Thru Study?
The Drive-Thru Study evaluated 13 QSR brands, including McDonald’s, Chick-fil-A, Burger King, Wendy’s, Taco Bell, KFC, Raising Cane’s, Popeyes, Dutch Bros, Tim Hortons, Starbucks, Dunkin’, and Arby’s.
-
Why are brands split into Classic, Chicken, and Beverage categories?
The study groups brands into Classic (burgers/tacos), Chicken (fastest-growing segment), and Beverage (coffee/tea-focused) to enable fairer, like-for-like comparisons within similar business models and customer expectations.
-
How was the data collected and over what period?
We conducted 2,145 mystery-shop orders across the U.S. from June to July, allocating 165 shops per brand for 13 brands, plus 120 AI-enabled orders (40 visits at three brands) for Voice-AI testing.
-
What metrics did the Drive-Thru Study measure?
The study measured Speed of Service, Order Accuracy, Suggestive Selling, Food Quality, and Overall Satisfaction. It separately evaluated Voice-AI Ordering against employee-led ordering at the same brands.
-
How has Voice-AI Ordering changed since last year?
Voice AI has made real progress. Locations running it compared favorably with employee-led ordering at the same brands on several key measures, a shift from last year's results. Comprehension is still the area to improve, since customers sometimes need to repeat parts of their order.
-
Does friendliness still matter in the drive-thru?
Yes. Friendliness remains one of the strongest links to customer satisfaction in the drive-thru. Friendly interactions went hand in hand with higher satisfaction, better accuracy, stronger value perception, and a greater willingness to recommend.
-
How can I get the full Drive-Thru Study report?
You can download the report by filling out the form on the page to have a copy delivered to your inbox, or by clicking the "Download the Report" button.
