Predictive analytics simplified
Let Intouch do the heavy lifting for you. With pre-built data models and visualizations, you can uncover actionable insights that drive real results.
Anchor the analysis to your business’ Key Performance Indicators to streamline operations, enhance experiences and improve the bottom line.
Using predictive analytics, the platform identifies the activities that will drive the greatest improvements so you can focus on critical and impactful tasks.
The predictive analytics capabilities in the Intouch Insight platform act as an always-on analyst working behind the scenes to unlock targeted insights so you can act immediately. Using existing program data, the built-in algorithm identifies the key drivers behind your KPIs and helps you prioritize which drivers to focus on in order to drive the greatest impact on performance.
The platform uses the data you are already collecting without having to pull together spreadsheets or crunch numbers manually.
Track the performance of your KPIs over time with pre-built visualizations to easily uncover patterns and measure changes over time.
Understand which aspects of your business have the greatest influence on your KPIs without the need for an in-house data analyst.
Key Drivers are automatically scored and ranked so you can see, at-a-glance, the relative importance of each driver on your business’s KPIs.
The interactive dashboards help you prioritize where to invest time and resources to achieve the biggest impact on overall scores.
Set specific timeframes for your analysis to stay focused on specific time periods when changes were rolled out to understand the impact.
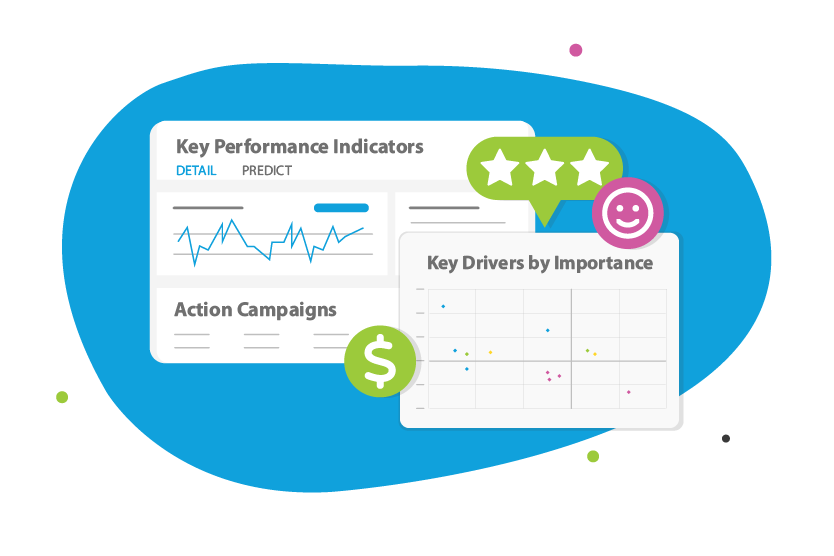
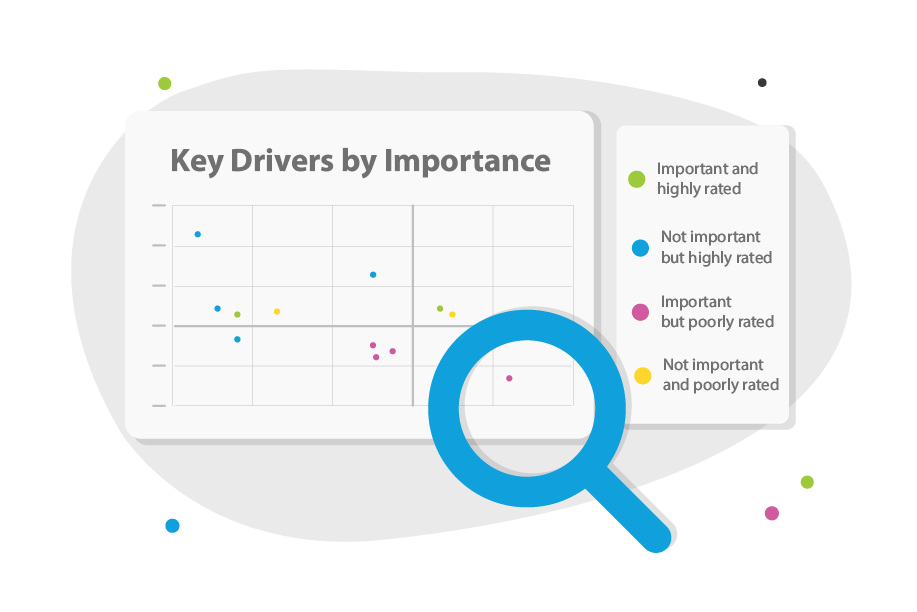
The Intouch Insight platform puts your businesses’ Key Performance Indicators (KPIs) at the center of all analysis. This focus keeps your team grounded on what matters most, and uses the data already being collected or any external data imported into the platform, to perform the Key Driver Analysis.
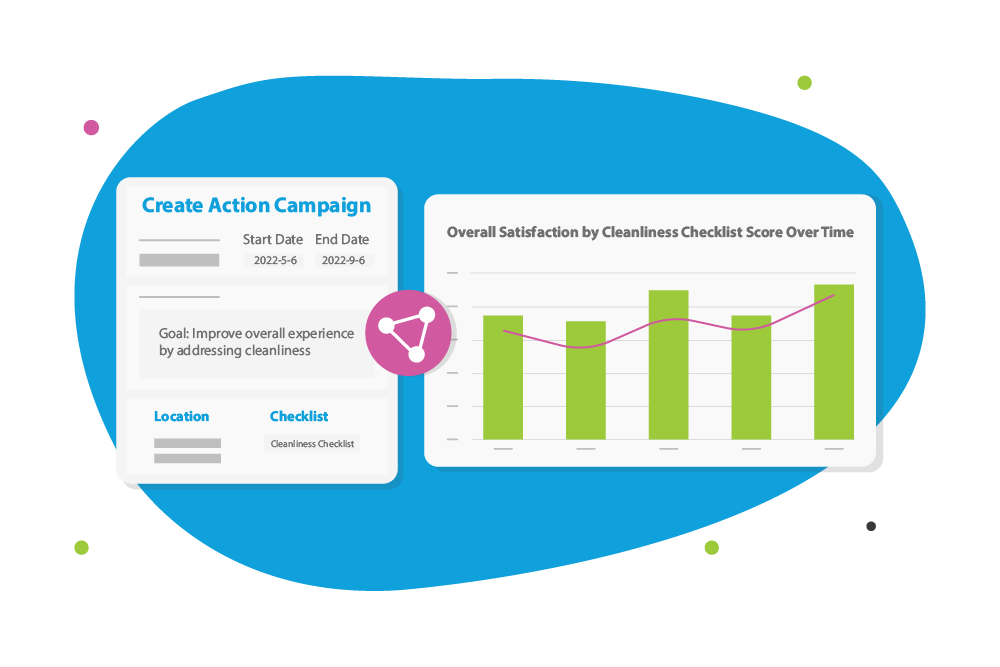
Once you’ve identified the Key Drivers for your KPI, build an Action Campaign to rally your organization, at every location around your shared objectives. Monitor the completion of campaigns and understand the impacts of actions taken to refine your operational performance.
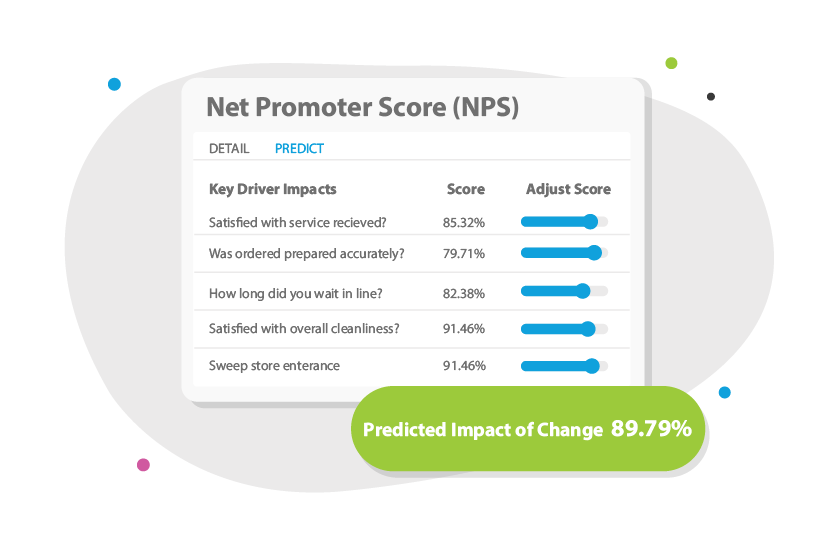
Use Intouch’s advanced tools to run prediction scenarios that measure the impact of improvements in the performance of Key Drivers on the outcomes of your KPIs. Use this information to focus your team’s activities on areas that will have the greatest impact.
It’s a set of features that automatically analyzes your program data to identify the factors (key drivers) that most influence your KPIs and uses predictive models to forecast how changes will affect those KPIs. The goal is to turn data into prioritized, actionable insights without heavy manual work.
No. The platform is designed to act as an “always-on analyst,” automatically running the statistical modelling, scoring, ranking, and visualization so non-technical users can interpret results.
The platform uses built-in algorithms and pre-built data models to analyze relationships between your collected data and chosen KPIs, then scores and ranks drivers by their relative influence. Visualizations show which drivers matter most so you can act quickly.
You can use the data you’re already collecting in IntouchCX™ platform and you can import external data if needed. No need to manually stitch together spreadsheets or run separate analyses.
It runs prediction scenarios using its models to estimate how improvements in specific key drivers will change your KPI outcomes, and provides interactive dashboards so you can compare scenarios and prioritize actions.
After identifying key drivers, you can create Action Campaigns to align locations or teams around targeted improvements, track campaign completion, and measure how those actions affect operational performance and KPIs.
You can request a demo or contact an Intouch Insight expert by filling out the form. A representative will schedule a personalized demo and discuss how the platform fits your needs.
Yes. Pre-built visualizations let you monitor KPIs over time and you can set specific timeframes to analyze the effect of rollouts or changes during defined periods.