Skip to the main content.

Inside the
On-Premise Experience
that sets leading QSRs apart.

How do ten leading QSRs make the counter experience count?
Intouch Insight’s first-ever On-Premise Study evaluates in-person guest experiences and reveals what really drives customer satisfaction at the counter.

WHO’S IN THE MIX? 10 WELL-KNOWN, CONSUMER LOVING QSR BRANDS.
Burger King logo Chick-fil-a logo Whataburger logo Jack in the Box logo Dunkin' logo Popeyes Logo Starbucks logo Subway logo Firehouse Subs logo

Inside the Report: How greetings, communication, and accuracy shape the On-Premise Experience.

Want more? On-Premise study offers a valuable benchmark for comparing performance across other touchpoints like drive-thru and third-party delivery.

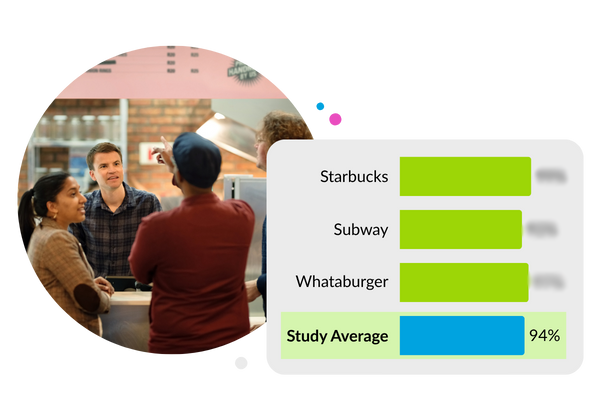
First impression matters

A simple greeting can significantly influence a customer's perception. The study found that when staff greeted customers upon entry, overall satisfaction and perceived friendliness increased. Conversely, the absence of a greeting made even efficient visits feel impersonal and transactional.

See who is getting it right →

Who's leading in making the first impression

Clear communication enhances accuracy

While order accuracy averaged an impressive 95%, the study revealed that clear communication during the ordering process further elevated customer satisfaction. Customers felt more confident and satisfied when staff clearly communicated expectations and order details, highlighting the importance of effective communication alongside accuracy.

See who is getting the message across →

Who's communicating clearly while maintaining order accuracy.

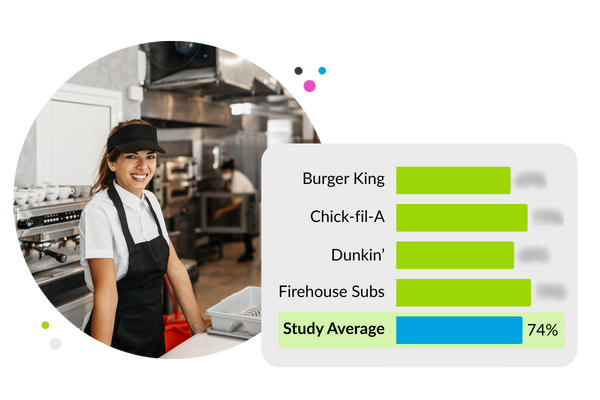
Speed is good but engagement is better

Quick service is expected, but the study showed that when staff engaged with customers during short waits, satisfaction levels remained high. In contrast, when delays occurred without any staff interaction, overall satisfaction dropped sharply.

See who made the wait worth it →

See what engagement can do to customer satisfaction
Key metrics we measured in the On-premise study

The key experiences that matter.

Research Methodology: How we collected data?

The study evaluated 10 QSR brands, with 75 mystery shops conducted per brand across geographically distributed locations in the US, covering lunch, snacks, and dinner dayparts.  

Mystery Shop Allocation 

A total of 750 orders were completed across 10 QSR brands. Mystery shoppers purchased one main, one side, one beverage and made one customization (no ketchup for example). 

Timing 

The study was conducted in January 2025. Shoppers were allowed to go any day of the week and order during any daypart of their choice - lunch (10:31 am - 1:30 pm), snacks (1:31 pm - 4:00 pm) and dinner (4:01 pm - 7:00 pm).

Metrics Measured

The study measures four key metrics: level of service & friendliness, order accuracy & quality, speed of service and overall experience.

Download the 2025 On-Premise Study


Discover how each brand stacks up.

Fill out the form to get your copy delivered right to your inbox.