
 Sarah Beckett
Is QSR Drive-Thru Customer Behavior Changing?
 Sarah Beckett : October 17, 2025
QSR drive-thru traffic is evolving. See how customer habits, AI tools, and service speeds are redefining performance in the latest drive-thru study.
For 26 years, our Drive-Thru Study has set the standard for how QSR brands measure performance. Each edition is built from months of fieldwork, data collection and analysis that turn hundreds of visits into insights the industry can trust. Over that time, the study has consistently tracked the core metrics that define every drive-thru customer’s experience: speed of service, order accuracy, satisfaction, food quality, and suggestive selling.
This year's results bring encouraging news. The average visit was the fastest we've recorded since 2018. Accuracy recovered. Satisfaction climbed. At the same time, the data shows how a small number of difficult visits, missed customizations, and uneven interactions can still shape the guest's view of a brand.
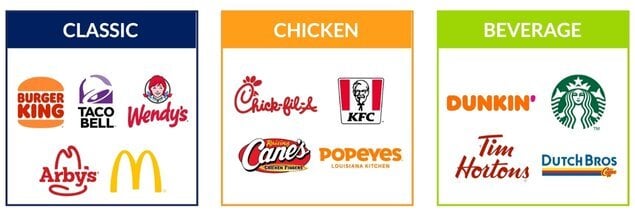
We've kept the Classic, Chicken, and Beverage segments introduced last year, making it easier to compare brands with similar menus and operating models. We also returned to Voice AI ordering to see how the technology has changed after another year in the field. Now we ask: Is Voice-AI a step toward long-term change, or is it still an experiment finding its place?
Here's what QSR leaders should know from the 2026 Drive-Thru Study. Let’s jump right in.

The 26th Annual Drive-Thru Study is based on 165 mystery shops per brand across 13 U.S. chains, with locations selected for broad geographic coverage. Shoppers also completed 120 Voice-AI orders at three brands where an AI assistant managed the ordering process. Those visits used the same mystery shop questionnaire as the main study, allowing a like-for-like comparison with the same three brands.
Data was collected from June to July 2026, with visits spread across breakfast, lunch, afternoon, and dinner periods, as well as different days of the week, to capture performance in real-world conditions.
The brands included in this year’s study are Arby’s, Burger King, McDonald’s, Taco Bell, Wendy’s, Chick-fil-A, KFC, Raising Cane’s, Dunkin’, along with four new entrants: Dutch Bros, Popeyes, Starbucks, and Tim Hortons.
Get the real picture of customer experiences at your stores.
Here's the 5 key steps to launching your own mystery shopping program.
The average visit took 5 minutes and 24 seconds, making 2026 the fastest year we've recorded since 2018. That's 11.1 seconds quicker than last year and nearly a full minute faster than the 2021 peak in total time. Nearly all the improvement came from a fall in average service time by 10.3 seconds.
But here's the caveat: half of all visits finished in less than 4:25 seconds. So it was a smaller group of very long visits that pulled the overall average higher, with the slowest 10% taking at least 9:56 seconds.
The satisfaction swing: The study average time which is within the 5-7 minute bracket, resulted in a 95.4% satisfaction. For ambitious brands, under 3 minute total time saw 95.4% satisfaction. But, once a visit passed ten minutes, satisfaction fell to 84.9%, and the likelihood to recommendation that brand was just 60.4%.
Here's the sweet spot: 3-5 minutes | 94.7% satisfaction | 81.7% would recommend the brand
A few brand comparisons:
Brands are racing to claw back seconds with double lanes, express pick-up windows, and bold new store designs.
And It makes sense because drive-thru speed equals revenue and according to the National Restaurant Association, 75% of all restaurant traffic is now takeout orders. Nearly 95% of consumers say speed is critical to the experience, and 90% rank it as their top priority. When seconds decide satisfaction, every improvement leads to stronger sales.
in our study, 38.4% of shoppers said that speed of service in a drive-thru is the is the most important factor in a visit. And as drive-thru customer behavior continues to change, the experience around those minutes matters too.
Want to know where all the speed gains are happening? Download the 2026 Drive-Thru Study to find out!
Customers want a simple and reliable system. They expect to head to the drive-thru, place their order, and receive exactly what they asked for every single time. This is the promise of today’s QSRs, and customers want to see it delivered.
By not doing so, brands begin to lose their trust. That’s how important accuracy is.
Drive-thru order accuracy reached 89.3% in 2026, up 2.4 percentage points from 2025. That's a welcome recovery, although roughly one in ten orders still included an error.
What caused the misses?
Where was accuracy strongest?
Shopper Quote: "There was a order mix up as I did order fries but I was given coleslaw. I didn't check the receipt till after I drove away and open up the bag."
A practical place for teams to focus on for better order accuracy is order confirmation. Across to the study, 85.3% of visits included some form of confirmation through a board or verbal read-back. Half of primary menu boards were digital, but just 44.4% of visits had an order confirmation board present. Location-level mystery shopping audits can show whether those tools and behaviors work consistently across locations and support higher order accuracy.
Jump right into our study to see the whole spectrum of insights!
“Do you want to make that a combo?”
“Would you like an apple pie with that?”
A few simple words can elevate the experience and bring more revenue to the table. The drive-thru is the perfect moment for this. It’s quick, direct, and gives brands a chance to offer customers options before they scan through a menu board. Yet suggestive selling appeared on only 51.6% of visits in 2026, down from 57.5% last year.
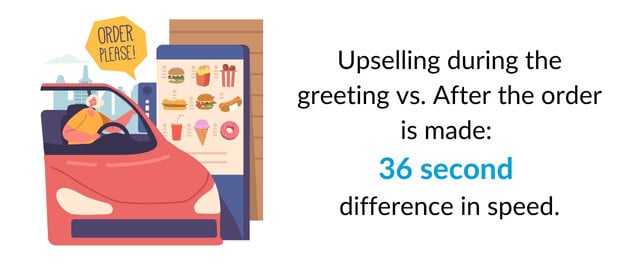
How the segments compared in suggestive selling:
Digital ordering can deliver consistent prompts at scale, as seen in suggestive selling within QSR mobile order-ahead experiences. The drive-thru still depends more heavily on frontline timing, menu design, and a team member making the ask.
Guests are also open to new flavors. When asked what they'd like to try next at a QSR, 41.1% chose a flavor profile with heat, including swicy, spicy, or bold options. Only 5.2% said they'd rather not try anything new. A well-timed suggestion can connect that appetite for discovery with a relevant add-on or limited-time offer.
Another great way to make customers aware of extra options, promotions and more items is by using presell boards. So, we dug deeper with customer surveys to also find out How Presell Boards Influence Drive-Thru Orders.
Taste. Temperature. Packaging.
Those three details decide whether a drive-thru meal travels well. In 2026, main-entree taste averaged 97.3%, while beverage quality reached 96.4%.
The food-quality snapshot:
Packaging added another useful view of the experience. Nearly nine in ten shoppers, 89.7%, rated their packaging perfectly secure and highly convenient. Another 96.2% felt at least somewhat confident eating the meal in their vehicle while on the go.
Effective restaurant mystery shopping measures more than one quality score. Taste, temperature, packaging, and portability each reveal a different part of whether the meal met the guest's expectations.
Was the lane easy to move through? Did the interaction feel friendly? Did the order arrive as expected?
Together, those moments lifted overall satisfaction to 93.8% in 2026, up from 91.2% last year. Starbucks led at 99%, followed by Chick-fil-A at 98% and Dutch Bros at 97%.
The strongest signal sits in how the visit felt. When shoppers described lane flow as perfectly smooth and efficient, satisfaction reached 97.1%. It fell to 87.4% when the experience felt slow or had a minor hitch, then dropped to 42.9% when the lane felt frustrating and inefficient.
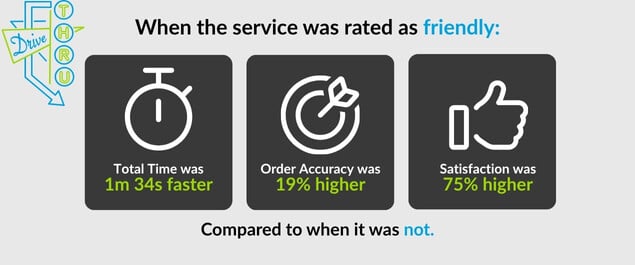
But friendliness really stood out as the thing that set some brands apart. Even in the drive-thru, where interactions are brief, customers still want the experience to feel personal.
When service was friendly:
When service wasn't friendly, satisfaction fell to 26.8% and strong recommendation intent dropped to 19.6%.
Here's the surprising part: friendly visits were also 25 seconds faster on average. Meaning that warmth from the staff didn't slow the lane down, but rather made it travel with better execution.
This matters because the study highlights a clear trend: brands with friendlier service consistently achieve stronger results across the board.
The same pattern appears across channels too because technically efficient on-premises service can still feel incomplete when the interaction lacks warmth.
Voice-AI pilots first appeared in drive-thrus a few years ago as QSRs searched for ways to cut labor costs, improve speed, and boost consistency. Today, more brands across North America are testing AI-enabled prototypes as a potential long-term solution.
So is Voice AI getting better at taking drive-thru orders?
The short answer is yes, with repetition still creating friction.
To uncover this drive thru trend further, we completed 120 visits at Burger King, Taco Bell, and Wendy's locations reported to be using Voice AI. The technology took some or all of the order on 92 visits and completed 77 from beginning to end.
What stood out:
Where did shoppers still feel friction?
Nearly three in ten had to repeat part of the order. And while 63% described the AI interaction as easy, 21.7% found it difficult.
Shopper Quote: "AI apparently defaulted to fries as a side of a combo meal when I wanted chili instead of fries as my side. As a result, I received and paid for an extra side. "
Voice AI is becoming more capable, but the whole visit still determines whether it succeeds. Targeted mystery shopping for Voice AI drive-thrus can show where the technology performs well, where an employee needs to step in, and what happens at the final handoff.
The 2026 Drive-Thru Study goes beyond the highlights we’ve shared here. Inside, you’ll find detailed brand comparisons, year-over-year drive-thru trends, and deeper insights into the shifts shaping the future of the drive-thru.
Curious about how your brand measures up to the top names in the industry? Become a Challenger Brand and find out!
You’ll receive:
Secure your spot for 2027 now. Contact: letschat@intouchinsight.com.
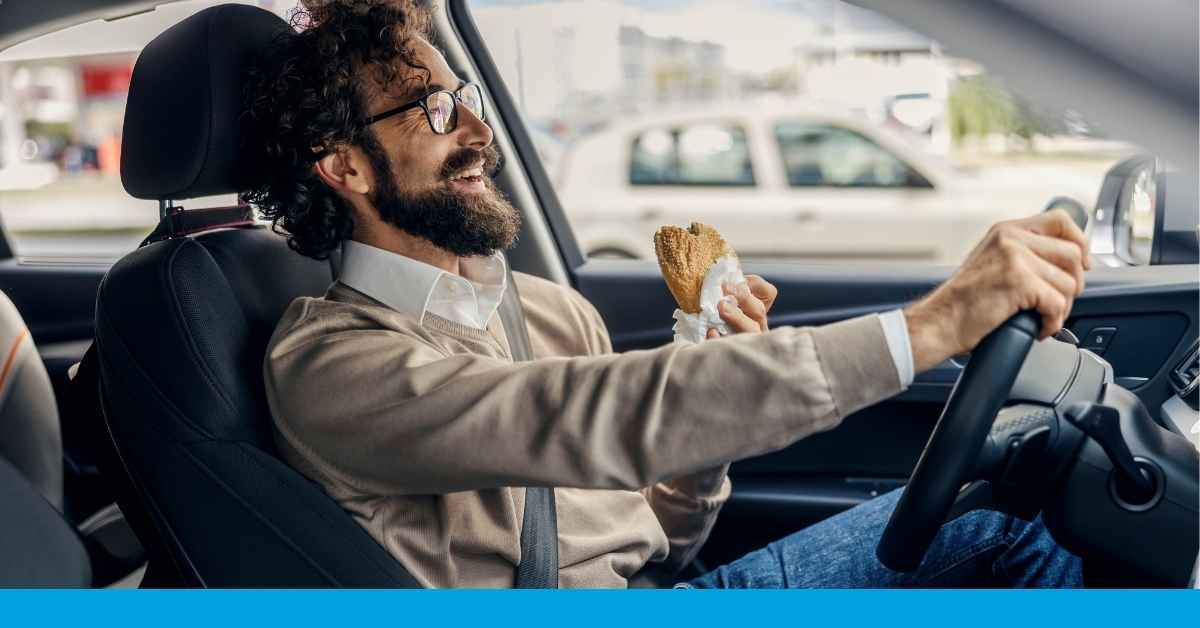 Sarah Beckett : October 17, 2025
QSR drive-thru traffic is evolving. See how customer habits, AI tools, and service speeds are redefining performance in the latest drive-thru study.
 Sarah Beckett : October 15, 2024
AI transforms drive-thru efficiency with faster, accurate order-taking and enhanced guest satisfaction, promising a future of seamless experiences in...
 Sarah Beckett : April 17, 2026
Use Drive-Thru Study data to benchmark KPIs, train teams, test tech ROI, and compete with industry leaders as a challenger brand using actionable...