Even after the pandemic-era growth, U.S. QSR traffic fell 3.5% year over year in August 2026. At the same time, the average drive-thru visit in our 2026 study dropped to 5 minutes and 24 seconds, the fastest we’ve recorded since 2018. Operators are refining QSR drive thru design around the parts of the visit customers value most, including order accuracy, lane flow, friendliness, and performance of technology.
With 42% of adults using a drive-thru at least once a week, the channel remains a routine part of how customers eat. The same 2025 National Restaurant Association research found that speedy service and good customer service are basic requirements for earning repeat off-premises business.
The 26th Annual Intouch Insight Drive-Thru Study gives us a closer look at how the QSR drive through performs in real customer conditions. Based on over 2,000 mystery shops across 13 QSR brands, the 2026 results show where design, process, technology, and frontline execution either support the customer or get in the way.

Here's what we understood in terms of drive-thru design:
Start QSR Drive Thru Design With What Customers Value
In 2026, the best QSR drive thru designs make the visit easy to move through, and hard to get wrong. This is done by prioritizing smooth lane flow, fast handoffs, accurate customized orders, clear order confirmation, friendly service, and Voice AI that can recover cleanly when a customer corrects or changes an order.
CUSTOMER PRIORITIES: 38.4% of customers named "speed of service" as the most important factor in a drive-thru visit, while 28.4% chose "order accuracy".
For a QSR drive-thru, that means every step should support one of two outcomes: move the customer forward or protect the order they placed. A confirmation step can prevent a mistake without adding a second process, and a well-run handoff can save time while giving the employee one last chance to check the order.
Where Drive Thru Speed of Service Is Won or Lost
Because 94% of consumers say speed is critical to the off-premises experience, drive thru speed of service can shape how the entire visit feels. In 2026, the biggest gains came after the customer ordered: total time improved by 11.1 seconds, service time improved by 10.3 seconds, out of which window time dropped by 7.5 seconds.
Most of that improvement came at the handoff, where orders need to be ready, easy to identify, checked quickly, and passed to the customer without adding another stop. Basically, a faster speaker interaction offers little benefit when the pickup point becomes the bottleneck.
What about the relationship between drive thru speed of service and loyalty?
Once total time passed ten minutes, satisfaction fell to 84.9% and only 60.4% of shoppers said they would recommend the brand; when visits stayed under five minutes, recommendation remained above 80%.
Design the Drive-Thru Lane Around Smooth Flow
When customers rated their QSR drive through experience perfectly smooth and efficient, visits averaged 4:45, satisfaction reached 97.1%, and order accuracy reached 91.8%. When the experience felt frustrating and inefficient, average time stretched to 11:18, satisfaction fell to 42.9%, and accuracy dropped to 69.8%.
Shopper Quote: " The route of traffic on the busy day was a mess at first. There was one lane open and then two. Customers did not understand the flow of traffic or line order until security had to be called in to direct traffic flow. Once in line you could not leave the line safely. My order was taken, but not read back. I did not get the whip cream addition as asked. Other than that staff did their best to manage."
Good QSR drive thru design closes that performance gap by connecting entry, ordering, payment, pickup, and exit in a journey that keeps customers moving and removes steps that create waiting, confusion, or rework.
Design for Customized Orders, Not the Simplest Order
Customization accounted for 43% of inaccurate orders in 2026, making it the largest source of misses; missing requested packaged condiments and receiving the wrong main entrée each accounted for another 13%. A drive-thru order now has to support the meal a customer actually wants, modifications included.
QSR drive-thru systems face more demands when an order is customized because the restaurant must capture the request correctly, carry it into preparation, and preserve it through the final handoff.
Shopper Quote: "I asked for pickles and extra pickles on the sandwich. The pickles were repeated back to me by the order taker, but were not added and did not appear on the receipt."
Order accuracy in the QSR drive through improved to 89.3%, up 2.4 percentage points from 2025. The remaining errors show where the next gains are likely to come from: better confirmation and fewer breakdowns between what the customer said and what the team fulfills.
Build Confirmation Into QSR Drive-Thru Systems
Across the 2026 study, 85.3% of visits gave customers and teams a chance to catch mistakes before the handoff through an order confirmation board or verbal read-back.
Order confirmation boards were present on 44.4% of visits, and 94.9% of those boards displayed the order correctly. Where there was no board, 77.7% of shoppers had the order read back to them.
In practice, QSR drive-thru systems support the experience when the board, POS, speaker process, and employee read-back all help ensure the restaurant prepares the same order the customer believes they placed.
For customized orders, that confirmation step becomes even more valuable. It's much easier to correct “no ice” at the speaker than after the drink has reached the car.
Keep the Human Interaction in QSR Drive Thru Design
More than 9 in 10 consumers rank customer service as a top off-premises priority, and the 2026 Drive-Thru Study shows just how much friendly frontline service shapes the drive-thru experience.
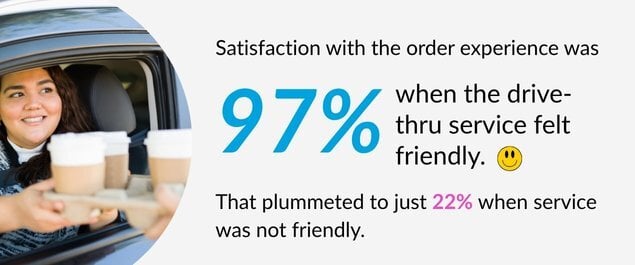
When service was rated friendly, overall satisfaction reached 98.6%, order accuracy reached 91.3%, and 86.5% of shoppers were very likely to recommend the brand. When service wasn't friendly, overall satisfaction fell to 26.8%, accuracy to 73.2%, and strong recommendation intent to 19.6%.
Whats more? In this study, a warmer employee interaction came with a 25-second speed advantage.
For operators, friendliness belongs in the service model alongside timing and accuracy. The window interaction may last only a few seconds, but it's often the clearest expression of the human side of the customer experience in the QSR drive through.
Want to see your brand through your customers’ eyes? See how you can launch a your own mystery shopping program.
Design Voice AI Around Real Ordering Friction
Voice AI is becoming a bigger part of QSR drive-thru systems, and the 2026 results show clear progress. Across 120 selected AI-enabled visits at three brands, total time averaged 5:14, almost identical to 5:15 for the employee-led ordering locations of the same brands.
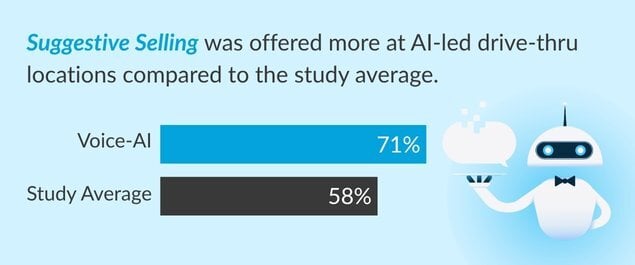
The selected AI locations recorded 90.8% order accuracy compared with 86.7% in the same-brand comparison, while suggestive selling reached 79.2% versus 59.2%. Overall satisfaction was also higher at 94.2% versus 91.7%.
At the selected AI locations, 29.1% of shoppers had to repeat part of their order, compared with 20.4% in the same-brand comparison, making correction and recovery the clearest remaining source of friction.
The more useful design question is how well QSR drive-thru systems handle the difficult parts of a real order, including changes, clarifications, and the moment an employee needs to step in. For customized orders in particular, recovery is part of the design.
Design the Drive-Thru for Value Across the Whole Visit
Consumers are actively looking for ways to make restaurant visits feel more affordable. In Q3 2026, 40% of consumers said they were using more discounts or value promotions than usual, up from 35% in the previous quarter.
Suggestive selling at a drive-thru can also give operators a chance to highlight cost-conscious options. But our study found that special promotions or new items accounted for just 7% of suggestive sells, giving teams an opportunity to make relevant offers more visible to customers already looking for ways to stretch their restaurant spend.
The latest drive-thru trends shows that value perception also tracks closely with how well the visit is executed.
Among shoppers who rated their visit good or excellent value, satisfaction reached 98.0%, order accuracy 92.2%, friendliness 86.5%, and secure packaging 94.7%. For shoppers who rated the experience poor value, those measures were materially lower.
In QSR drive thru design, value is created across the visit through the food, accuracy, service, packaging, and convenience customers receive for the price they pay.
What Good QSR Drive Thru Design Looks Like in 2026
For restaurant and QSR leaders, Intouch Insight's 2026 Drive-Thru study provides a practical design brief. The strongest opportunities sit in the parts of the visit customers already told us they value most.
- Keep lane flow predictable. Customers should understand what happens next from ordering through exit.
- Protect the handoff. Most of the 2026 speed improvement came from service and window time.
- Design for customized orders. The process has to capture modifications clearly and carry them through fulfillment.
- Build confirmation into the order-taking process. Boards and verbal read-backs should help catch mistakes before the handoff.
- Keep friendliness in the operating model. Faster service and a stronger interaction can happen at the same time.
- Give Voice AI a clear recovery path. Customers need an easy way to correct the order or reach an employee when the system misses something.
A QSR drive through can look efficient on paper and still break down location by location. That is why operators need to measure the design in real customer conditions, not only confirm that the technology and process exist.
Location-level mystery shopping programs can show whether the intended QSR drive thru design works consistently across locations by tracking the customer experience metrics that matter most, including speed, accuracy, lane flow, order confirmation, friendliness, and the handoff.
A centralized CX platform can bring those location-level results together, surface recurring gaps, and help teams track whether corrective actions improve the experience over time.
Download Intouch Insight's 2026 Drive-Thru Study
Grab a hold of the complete benchmark behind these QSR drive thru design priorities in the 2026 Drive-Thru Study.
It's Free! Simply fill out the form below for your own copy.
Benchmark Your Brand Against Industry Leaders
Curious about how your brand measures up to the top names in the industry? Become a Challenger Brand and find out!
You’ll receive:
- Your Brand Data: 150 mystery shops conducted at your locations, including all shopper fees and food reimbursements.
- Complete Research Package: Access your results alongside those of 13 benchmark brands, with raw data files included.
- Custom Reporting: Your portal will come pre-loaded with custom dashboards tailored to your brand, plus a personal advisory call to review the results.
Secure your spot for 2027 now. Contact: letschat@intouchinsight.com.

 Sarah Beckett
 Sarah Beckett : October 06, 2026