
 Sarah Beckett
1 min read
3 QSR Customer Experience Mistakes to Measure and Fix in 2026
The quick service restaurant (QSR) customer experience is shaped by small, repeatable moments at the front line.
Picture this: Your customer steps up to the counter at your quick-service restaurant. They're greeted with a smile, their order’s taken without a hitch, and five minutes later, the food is hot, fresh, and exactly how they asked for it. The whole experience feels… smooth.
Now imagine the same scenario, minus the eye contact, minus the friendly farewell, and minus the feel of what it means to be at your restaurant.
The difference? It’s subtle—but it’s everything.
That’s the heart of our 2026 On-Premises Study, where we evaluated in-person counter service experiences at 10 leading QSR brands. With 75 mystery shops per brand, covering breakfast, lunch, and dinner dayparts, we captured a "transactional gap", where the focus on technically efficient QSR operations have possibly lead to a decline in human connection.
Let’s dig into the data.

Brand-by-brand comparisons on every metric, including speed, satisfaction, friendliness, suggestive selling, and more, are shown across all 10 brands in the study. Download the report for the full breakdown.
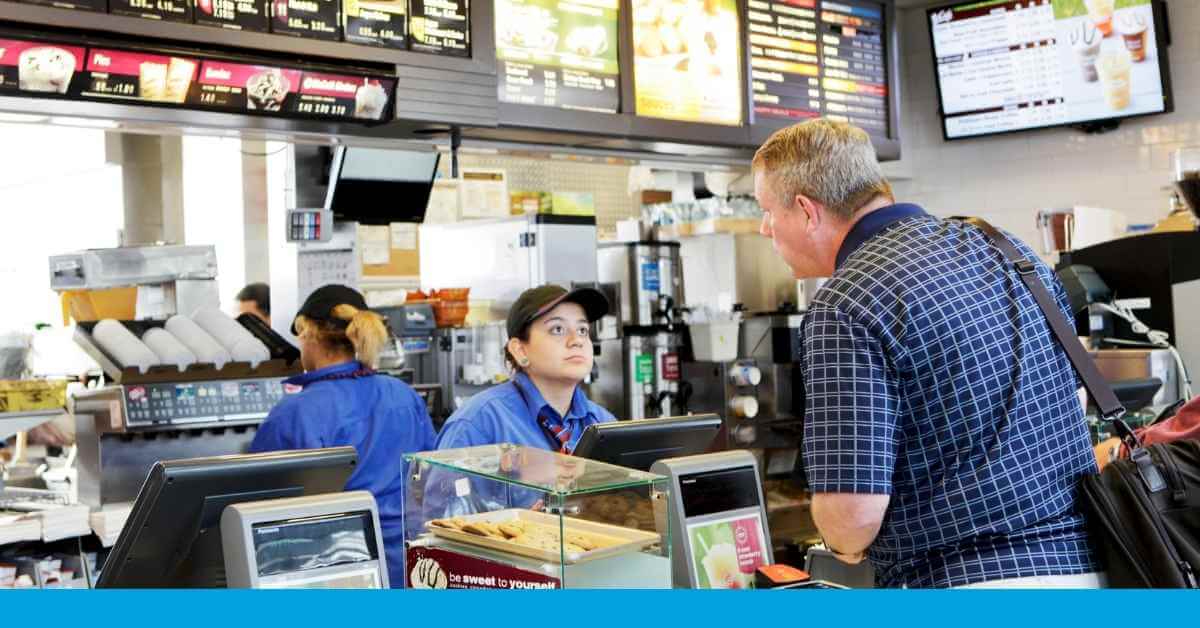
When staff greet customers upon entry, overall satisfaction and perceived friendliness takes a serious leap. Mystery shoppers described such interactions as warm, welcoming, and memorable. But when that greeting was skipped, even efficient visits felt “cold” and “transactional”.
As technology expands and operations become more efficiency-driven in quick service restaurants, less emphasis is being placed on the human side of service. This year’s report highlights clear gaps in the experience:
When service was friendly, overall satisfaction was 98.9%, a staggering 67.7 percentage points higher than when service was not friendly.
That difference was 43 percentage points last year, signaling a clear drop in tolerance for not-friendly service.
To better understand the trade-off between efficiency and warmth, we looked at “neutral” service, where staff were attentive and orders moved efficiently, but there was little human connection. In these cases, overall satisfaction was 12 percentage points lower than with friendly service.
The conclusion?
Attentiveness keeps things complaint, but it does not create long-term customers. The difference comes down to simple behaviors like greeting, smiling, using eye contact and courteous language.

Fast service is still the expectation, and for good reason. On average, guests received their orders in just over 4 minutes, a whole minute faster than last year.
Subway had the fastest average service time at just over 2 minutes, while some brands were as slow as 6 minutes. But longer times were often tied to more complex or made-to-order items.
Still, speed alone doesn’t tell the full story.
The real insight came down to how guests perceived that speed, and whether it matched their expectations.
When orders were perceived as quicker than expected, satisfaction reached 98.5%. But when a visit felt slower than expected, satisfaction dropped sharply to 76.9%, regardless of the actual time.
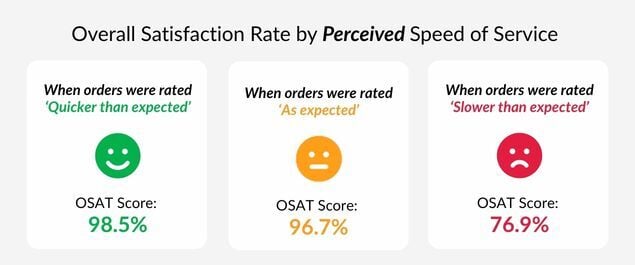
The difference comes down to how that time is experienced. This leads us back to the transactional gap. When the experience lacks human connection, even a reasonable wait can feel longer than it is.
It showed up in our mystery shopper feedback as well. Among those who identified areas for improvement, speed of service was the most cited, at 12.6%. This reinforces that speed remains a key driver of satisfaction for QSRs to focus on, and that communication during wait times can go a long way.
Daypart Insight: Dinner had the longest total time (7:04) and the lowest speed satisfaction (86.3%), making it the most critical moment for managing perceived speed.
The average suggestive sell rate across the On-Premises Study was 60.6%, meaning about 4 in 10 customers were not offered any value additions that could have been accepted.
The practice of suggestive selling varied widely by brand. Some brands consistently prompted add-ons in over 70% of visits, while others fell below 25%.
It's the single largest missed revenue opportunity for QSRs this year.
Suggestive selling stands out as a missed opportunity because of the sheer revenue that could be gained with small improvements. It requires relatively low effort in coaching, and it is easy to observe and measure.
Explore suggestive sell rates by brand. Download the full study below ↓
Across the study, accuracy averaged 92.7%, which means that 1 in 13 orders had an error. This matters because when an order was correct, overall satisfaction was 16 percentage points higher than when it wasn’t.
Temperature told a similar story. The satisfaction ratings was 95.2% when food temperature met expectations, but dropped to 78.9% when it did not.
These are no longer differentiators. Guests need their orders to be correct and to meet quality expectations. When brands miss them, the result is often a “not satisfied” outcome.
Explore the top strategies to Improving Restaurant Efficiency, and achieve greater accuracy and speed for your QSR operations.
A Quantum Workplace survey found that 72% of senior executives strongly agree that organizations with highly engaged employees have more satisfied customers. Yet many QSRs have not effectively integrated employee experience data with customer experience data.
That's a starting point for closing the transactional gap discussed throughout this article.
By integrating employee behavioral scores from mystery shops into a powerful CX platform, location managers can see the direct impact their teams have on customer satisfaction.
If you want this level of clarity into the total experience across your locations, my team can help.
1 min read
The quick service restaurant (QSR) customer experience is shaped by small, repeatable moments at the front line.
1 min read
For 25 years, the Drive-Thru Study has set the standard for how QSR brands measure performance. Each edition is built from months of fieldwork, data...
1 min read
Most customers already know exactly what to do with mobile ordering. They open the app, place an order, and move on. It’s fast, predictable, and...